|
Interpreting Data from Mars Here is a compilation of all the Mini-TES data released to the public: A brief overview of how to read these data:
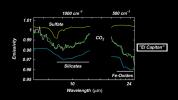
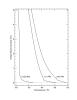
Every mineral has its own thermal emissivity "signature" or spectra. Think of it as its own DNA sequence. Each sort of chemical bond in a mineral will emit distinctive radiation at a certain wavelength. And if you know exactly what a pure mineral's spectra is, and your rock's spectra looks awfully close to to it, chances are that your rock is composed largely of that mineral. Now, in a rock, there might be tens of minerals that appear in your spectra, and it makes the job of identifying minerals much more harder. But those key "squiggles", where you see a big dip or a characteristic squiggle, helps you to determine what your rock is made out of.
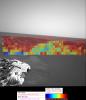
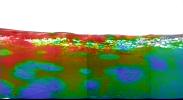
Now take the spectra on the right for example. Each thermal reading is one circle on the map. That is the average temperature in that circular area. Dust (in the upper part of the image) usually holds in more heat, and so is warmer than the surrounding area. It is assigned a red colour. But note that dark blue circle near the bottom left. Mini-TES has centered in on a large rock. Individual rocks tend to be cooler than dust, and since that rock takes up most of Mini-TES' field of view, it records a lower average temperature, and the scientists have assigned it a blue colour. Now you're ready to analyze some of the data from Mars: 20 March Phil Christensen discusses the hematite "blueberries" (*.asx file - Discovery Channel Canada) 11 March Rover Press Briefing with Phil Christensen (RealVideo file)
2 March 14 February 12 February 4 February 31 January 14 January
9 January
Also, visit Mini-TES' website at: http://minites.asu.edu/latest.html Any Questions? Please send them to Imagiverse - Ask The Expert Page content written by Stephanie Wong. |
| Last
Updated: 21 March 2004 |
| Home | Contact Us | Credits | Sitemap | © 2004 - imagiverse Educational Consortium |
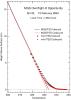
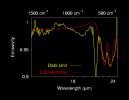
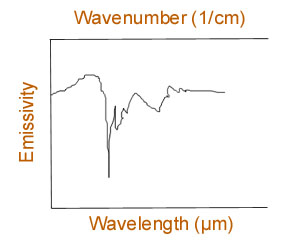 Some of the "squiggly-line"
graphs tell how much radiation at a certain wavelength or
wavenumber. The y-axis (vertical axis) tells us the
emissivity, or "how much" radiation is coming
out of the sample. On the x-axis (horizontal), we
can tell at what wavelength or wavenumber that the
emission data was recorded. The x-axis is labelled
in both wavelength and wavenumber because it might be
better to choose one over the other when comparing to
other data. Wavenumber is simply 1 divided by the
wavelength. Note, however, in this case, that
wavelength was in micrometers and wavenumber is in
centimeters-1, so you must convert your
units carefully.
Some of the "squiggly-line"
graphs tell how much radiation at a certain wavelength or
wavenumber. The y-axis (vertical axis) tells us the
emissivity, or "how much" radiation is coming
out of the sample. On the x-axis (horizontal), we
can tell at what wavelength or wavenumber that the
emission data was recorded. The x-axis is labelled
in both wavelength and wavenumber because it might be
better to choose one over the other when comparing to
other data. Wavenumber is simply 1 divided by the
wavelength. Note, however, in this case, that
wavelength was in micrometers and wavenumber is in
centimeters-1, so you must convert your
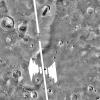
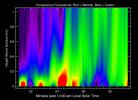
units carefully.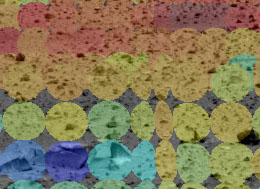 The Mini-TES takes
thermal pictures on Mars. Instead of capturing
light, as we do with our own eyes, it captures heat, or
more appropriately thermal radiation. A
scientist then assigns a colour to each temperature and
then places them on a map. What's with all the
circles, though? Think of Mini-TES as a digital
camera with a really big pixel size. Unlike the
Pancam, which has a high resolution, Mini-TES just takes one
temperature measurement with each picture. While a
visible light image with a giant pixel size (i.e. big
blocks of colour) wouldn't tell us much about Mars, broad
thermal measurements can tell us a lot about what the
rocks are made of.
The Mini-TES takes
thermal pictures on Mars. Instead of capturing
light, as we do with our own eyes, it captures heat, or
more appropriately thermal radiation. A
scientist then assigns a colour to each temperature and
then places them on a map. What's with all the
circles, though? Think of Mini-TES as a digital
camera with a really big pixel size. Unlike the
Pancam, which has a high resolution, Mini-TES just takes one
temperature measurement with each picture. While a
visible light image with a giant pixel size (i.e. big
blocks of colour) wouldn't tell us much about Mars, broad
thermal measurements can tell us a lot about what the
rocks are made of.